
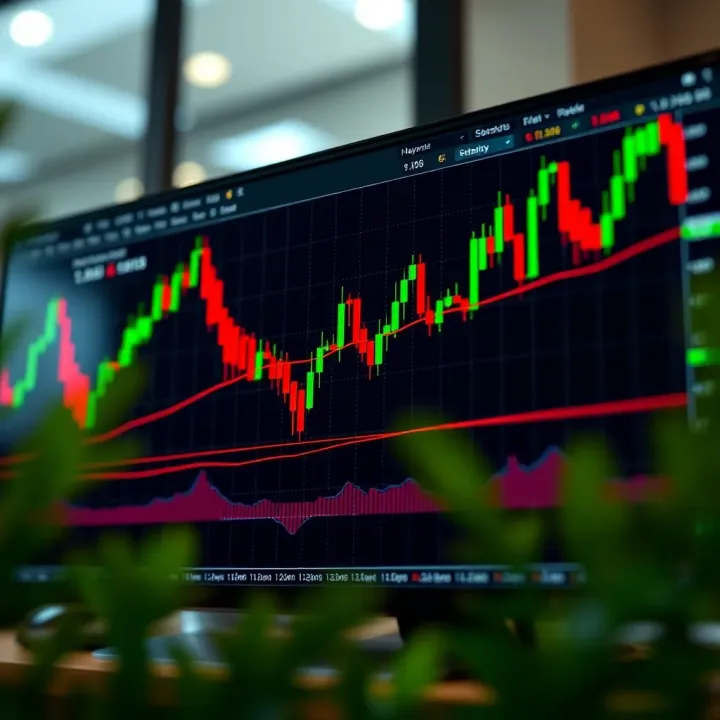
Mastering Multiple Candlestick Patterns in Trading
📊 Explore key multiple candlestick patterns in trading, their psychology, and how to interpret them for smarter decisions in India's stock markets!
Edited By
Chloe Edwards
Candlestick patterns form a vital part of technical analysis for traders and investors dealing in the Indian stock market. They help capture price movements visually, making it easier to interpret market sentiment within daily or intraday charts. Unlike plain line graphs, candlestick charts display the open, high, low, and close prices, which investors use to identify potential reversals, continuations, or pauses in market trends.
The strength of candlestick patterns lies in their ability to convey complex information through simple visual cues. For instance, a long green (or white) candle suggests strong buying pressure, whereas a long red (or black) candle indicates selling dominance. Recognising patterns like the bullish engulfing, hammer, or bearish shooting star can guide you to make informed decisions on buying or selling.

Understanding these patterns requires more than just memorising shapes. It involves analysing context — volume, previous trend, and confirmation from other indicators.
To make the learning process easier, detailed images of individual candlestick patterns greatly help. Annotated charts explain exactly what each pattern signals, showing you real market scenarios from Indian stocks like Reliance Industries or Tata Motors. These examples help bridge theory and practice, crucial for traders aiming to master timing and entry points.
In addition, downloadable PDF resources are invaluable study aids. They let you revise patterns offline, categorise bullish and bearish setups, and apply checklists before trading. For students and financial analysts, having these PDFs on hand assists in preparing for exams or client presentations.
Key points to focus on:
Recognise common bullish patterns such as hammer, morning star, and bullish engulfing
Identify bearish patterns like shooting star, evening star, and bearish engulfing
Know how volume and previous trends affect reliability
Use PDFs as quick reference tools to validate your technical analysis
Mastering candlestick patterns equips traders with practical insights to navigate the Indian market's volatility. It sharpens timing, reduces guesswork, and improves risk management. This foundation, combined with other Indian market tools and regulatory awareness, forms a well-rounded trading strategy.
Candlestick patterns are a fundamental tool for traders and investors in understanding market sentiment and price movements. These patterns provide a visual snapshot of price behaviour over a given time frame, showing the opening, closing, high, and low prices. For those involved in the Indian stock market or other trading arenas, recognising these patterns helps in making timely and informed decisions.
Simply put, candlestick patterns are specific formations created by one or more candlesticks on a price chart. Each candlestick resembles a small rectangular bar with lines (wicks) extending above and below, depicting price action within a set period. For example, a bullish hammer pattern often signals a potential upside reversal after a downtrend, showing buyers stepping in with strength. Conversely, a shooting star pattern suggests a likely reversal after an uptrend, indicating sellers gaining control. These patterns summarise the battle between buyers and sellers, helping traders anticipate future price trends.
Visual learning is key when it comes to candlestick patterns. Charts and images allow traders to quickly identify complex market signals that words alone cannot convey. Seeing a pattern like the engulfing bullish or evening star with corresponding trade volume and price levels helps solidify understanding. This visual clarity is especially helpful for freshers or those new to chart analysis. Moreover, coloured candlestick charts—green for bullish moves and red for bearish—improve the speed of pattern recognition.
Clear images of candlestick patterns make it easier to grasp market dynamics and thus improve trading accuracy.
In practice, traders often supplement learning with PDF guides that combine detailed images and notes. Such resources serve as handy references during market analysis and support continuous learning. For example, having a PDF with annotated bullish and bearish patterns helps traders reinforce pattern recognition in real-time markets like the Bombay Stock Exchange (BSE) or National Stock Exchange (NSE).
Overall, introducing candlestick patterns with strong visual examples lays the groundwork for applying this method effectively. Once familiar with the basics, traders can proceed to more advanced patterns and integrate them with broader Indian market trends for better results.
Understanding common candlestick patterns through images helps traders spot potential market moves quickly. Visual cues like the shape and length of candlesticks reveal shifts in buying or selling pressure, which raw numbers alone can obscure. For instance, a single pattern on a price chart can signal an upcoming trend reversal or continuation. This makes images an essential learning tool, especially for those applying patterns in fast-moving markets like Indian equities.

The hammer pattern appears at the bottom of a downtrend and signals a possible reversal to upward movement. It features a small real body near the top of the candle and a long lower shadow. This lower shadow shows that sellers pushed prices down during the session but buyers regained control by the close. Traders often look for confirmation with the next candle closing higher before entering a buy position. For example, Nifty stocks like Reliance Industries have shown hammer patterns after sharp dips, hinting at recovery.
This pattern consists of a small bearish candle followed by a large bullish candle that completely ‘‘engulfs’’ the previous one’s body. It suggests strong buying momentum overtaking the prior selling pressure. The engulfing bullish pattern is valuable during market dips, providing a clear entry signal when the second candle’s volume is high. Indian traders tracking Bank Nifty options might use this pattern during corrections to identify short-term buying opportunities.
The morning star is a three-candle pattern marking the end of a downtrend. It starts with a long bearish candle, followed by a small-bodied candle (indecision), and then a long bullish candle. This sequence indicates the shift from sellers’ control to buyers gaining strength. Seeing this pattern near support levels, such as at the 200-day moving average in stocks like HDFC Bank, can reinforce the confidence to enter long trades.
Opposite of the hammer, the shooting star appears at the top of an uptrend. It features a small real body near the bottom and a long upper shadow. This shows buyers pushed prices higher but sellers took over by the close. It warns traders of a potential reversal or pullback. In Indian markets, such patterns often appear after sharp rallies in mid-cap stocks, indicating profit-taking.
This pattern is a bearish flip of the bullish engulfing. A small bullish candle is followed by a larger bearish candle that engulfs the previous body, signalling supply overpowering demand. Traders use this to prepare for downward moves, especially when confirmed with high volume and resistance zones. For example, IT stocks like Infosys have shown this pattern before correcting after extended rallies.
Similar to the morning star but bearish, the evening star consists of a long bullish candle, a small indecisive candle, and a long bearish candle. It reflects a market transitioning from buying pressure to selling pressure. This pattern near resistance or psychological levels, such as ₹3,000 for certain stocks, warns traders to book profits or tighten stop losses.
Visualising these key patterns helps traders test strategies effectively and improves decision-making. Combining images with practice sharpens the ability to identify genuine signals and avoid false alarms.
Having a PDF guide on candlestick patterns can simplify your learning process and serve as a reliable reference during trading sessions. PDFs condense complex information into organised formats, often with images, charts, and step-by-step explanations that you can easily refer to anytime. Unlike online articles, they're accessible offline, so you can study even when internet connectivity is poor, which is common in many parts of India.
PDFs offer several benefits over other learning resources. They provide a structured layout, allowing you to follow a sequence — for example, starting from basic to advanced patterns. This helps build a strong foundation rather than jumping between scattered online posts. Many PDF guides include multiple images alongside descriptions, making it easier to visualise patterns like the "Hammer" or "Evening Star" before spotting them on Indian market charts.
Another advantage is portability. You can download these files on your mobile, tablet, or laptop and review them on the go — useful when you commute or have short gaps during your day. PDFs also allow quick search and highlight features, so you can mark important notes for later revision. Some PDFs even come with printable versions of pattern cheat sheets, which traders can keep handy for quick reference.
When choosing PDFs, prefer those made by credible financial educators or brokerage firms that understand the Indian stock market nuances. For instance, firms providing resources aligned with SEBI (Securities and Exchange Board of India) regulations tend to offer accurate information respecting local market practices.
Look for PDFs available in low to medium file sizes (under 5 MB) to ensure they open quickly on mobile devices without straining your data pack. Formats that use colour-coded images rather than just text aid quicker pattern recognition.
Some reputable sources might bundle PDFs with interactive content, like embedded hyperlinks to Indian market data or explanatory videos. While strictly a PDF, such resources add value and depth to learning.
In sum, combining visual aids with portable, well-structured PDF guides creates an effective learning toolkit for traders wanting to master candlestick patterns. Using these PDFs alongside live charting tools will sharpen your analysis and help you make informed decisions in Indian markets.
Understanding candlestick patterns specifically within the Indian market helps traders gain a realistic edge by considering local market behaviour, regulatory events, and economic factors. Since the Indian stock market has its distinct rhythm influenced by domestic policies, corporate earnings, and global developments, integrating these patterns requires awareness of these dynamics.
Candlestick patterns take on added significance when combined with prevailing Indian market trends. For example, during monsoon months, sectors like agriculture and FMCG often react strongly to rainfall reports, shifting trader sentiment visible through price actions and confirmed by patterns like the bullish Hammer or bearish Shooting Star. Tracking Nifty 50 or Sensex index movement alongside these patterns provides clearer signals on entry or exit points.
Market holidays and quarterly earnings announcements typically cause volatility spikes. Traders should watch for reversal patterns like the Morning Star after a steep fall during budget season or the Evening Star near fiscal year endings. Also, incorporating sector-specific news — such as RBI policies affecting banking stocks — complements pattern analysis, offering a practical method to assess risk and opportunity.
Apply candlestick analysis in conjunction with volume and support-resistance levels common in Indian charts for better-confirmed trades. Avoid relying on patterns alone; for example, a bullish Engulfing pattern needs volume confirmation to confirm genuine buying interest in stocks like Reliance Industries or Tata Motors.
Use stop-loss orders effectively to limit downside risks since Indian markets can swing sharply in reaction to unexpected geopolitical or economic news. Developing a watchlist of specific stocks with historically responsive patterns helps sharpen focus rather than watching too broad a set.
Lastly, backtest patterns on historical NSE and BSE data to understand their effectiveness in real Indian market conditions before committing real capital. Consistency and disciplined application of these tips increase the chances of generating meaningful returns while navigating the complexities of Indian market behaviours.
Successful use of candlestick patterns in Indian markets hinges on blending technical signals with a solid grasp of local economic and corporate developments, ensuring decisions are anchored in practical realities rather than technical theory alone.
By combining pattern study with India-specific factors, traders build a robust framework for smarter decision-making that suits the country's unique market environment.
Wrapping up your journey through candlestick patterns, it's clear that understanding these formations plays a significant role in making informed trading decisions. This section sums up key insights and points you to trustworthy resources where you can deepen your knowledge with downloadable PDFs—tools that many traders find invaluable for quick reference and learning on the go.
Candlestick patterns provide visual cues about market sentiment, helping traders predict price movements more confidently. We explored essential bullish formations like the Hammer and Morning Star, known for signalling upward shifts, alongside bearish counterparts such as the Shooting Star and Evening Star, which spell potential reversals downwards. Remember, no pattern guarantees success alone; combining these with other indicators and market context improves accuracy.
Images clarify each pattern's structure, making it easier to spot them during live trading. Meanwhile, having PDFs on hand means you can revise these patterns even without internet access—practical for traders in tier-2 or tier-3 cities where net might falter. Applying these patterns specifically within the Indian market requires attention to local trends and events, like quarterly results announcements or regulatory changes, which can impact price behaviour.
Finding credible PDFs dedicated to candlestick patterns ensures you’re learning from accurate and well-structured material. SEBI (Securities and Exchange Board of India) and NSE India websites offer educational content and sometimes PDFs relevant to trading concepts including technical analysis. Financial education platforms like Zerodha Varsity also provide detailed guides and downloadable content that suit beginners to advanced traders.
Beyond official sources, many Indian trading communities share curated PDFs that focus on practice-oriented explanations and examples drawn from markets like NSE and BSE. When selecting PDFs, choose those updated recently and that explain patterns with illustrations and contextual examples reflecting local market conditions. This practical approach helps internalise patterns instead of memorising them superficially.
Keeping quality resources handy means you can revisit the basics any time and remain agile in your trading decisions, especially when the market shifts quickly.
In essence, this final section aims to connect what you've learned with tools and references that support ongoing learning, making your trading practice both informed and agile within the Indian financial ecosystem.
📊 Explore key multiple candlestick patterns in trading, their psychology, and how to interpret them for smarter decisions in India's stock markets!

📈 Learn key candlestick patterns for stock trading 📊 Understand price action & market trends. Download free, reliable PDF charts for easy Indian market analysis.

📈 Explore the best candlestick patterns to read market mood and spot price moves. Learn single, double, and multiple setups to trade smarter and reduce errors.

📊 Learn key candlestick patterns to read stock charts clearly, spot price moves early, and manage risks wisely in the Indian markets. Start trading smarter today!
Based on 12 reviews