
Mastering Candlestick Patterns for Traders
📊 Learn to master candlestick patterns with practical tips & PDF guides! Perfect for traders of all levels aiming to improve their strategy and analysis.
Edited By
Charlotte Dawson
Candlestick patterns are vital tools for anyone interested in stock market trading, especially in the Indian context where markets like the NSE and BSE play a pivotal role. These patterns provide visual cues about price movements, helping traders and investors make informed decisions without relying solely on numbers.
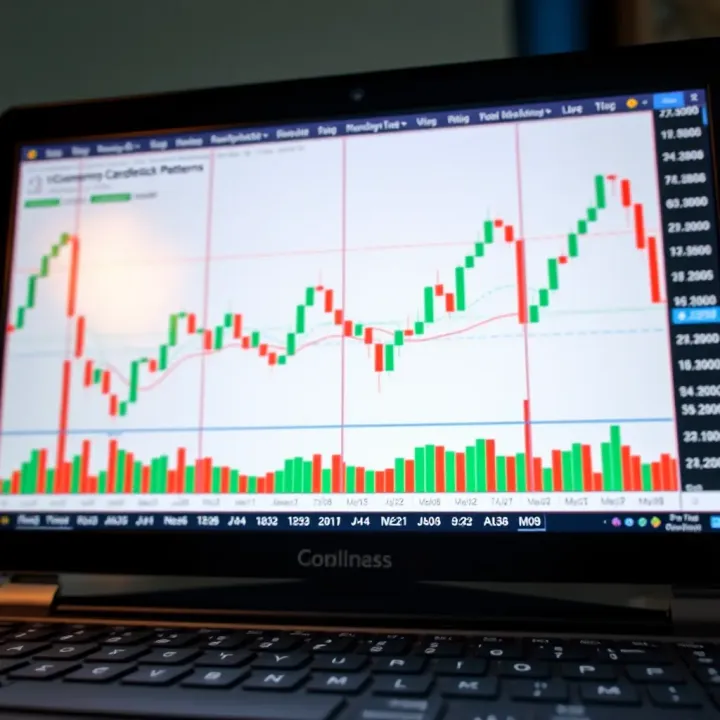
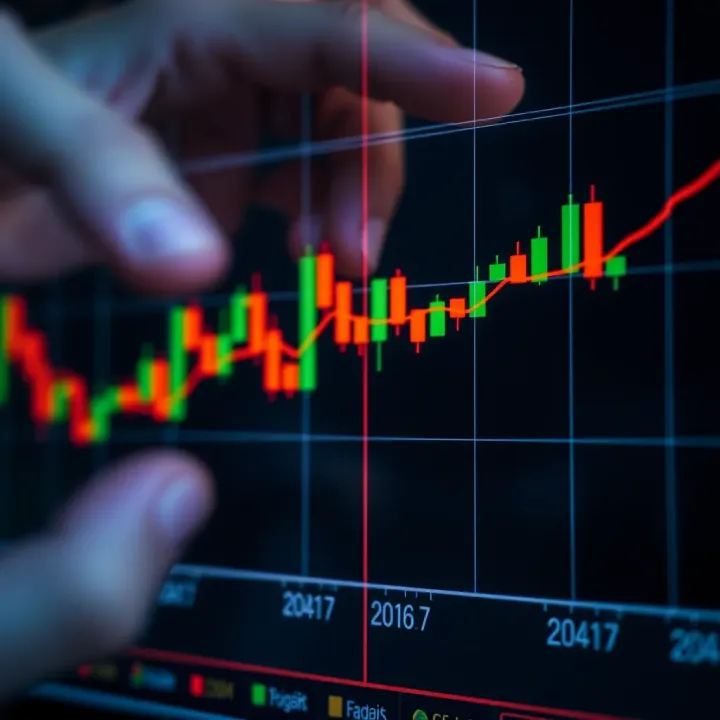
A candlestick chart displays price action over a specific time frame, typically showing the open, high, low, and close prices. Each 'candlestick' consists of a body and wicks (or shadows), where the body reflects the price range between open and close, and the wicks indicate the extremes — the highest and lowest trades in that period.

Understanding basic candlestick patterns can help spot potential market trends or reversals early. For instance, a bullish engulfing pattern suggests that buyers are gaining control, which might indicate an upward price move. Conversely, a shooting star formation signals selling pressure and possible decline.
Recognising these patterns not just aids timing entries and exits but also assists in managing risks effectively by signalling when to stay cautious.
Some common patterns every beginner should know include:
Doji: A candle where open and close prices are nearly the same, indicating indecision between buyers and sellers.
Hammer and Hanging Man: Both have small bodies with long lower shadows but appear in different market contexts. The hammer suggests a bullish turn after a downtrend, while the hanging man warns of a bearish reversal following an uptrend.
Engulfing Patterns: When one candle fully covers the previous candle’s body, reflecting a potential shift in momentum.
Applying candlestick analysis alongside other technical tools like volume and moving averages improves reliability. For example, spotting a bullish pattern with rising volumes strengthens the buy signal.
Given the volatility of Indian markets around events like quarterly results or RBI announcements, candlestick reading can give traders an edge to anticipate swift price changes and protect capital.
Mastering these basic candlestick formations equips you to understand market sentiment better and become more confident in your trading or investment choices.
The following sections will guide you through specific patterns, their significance, and practical usage tips tailored for Indian equities and derivatives.
Grasping candlestick charts is essential for anyone serious about reading stock movements in the Indian markets. These charts give you a clear snapshot of price action during a specific trading interval, helping you quickly decide if bulls or bears held sway. Knowing how to read these can improve your entry and exit timing, which ultimately impacts profit and loss.
Each candlestick represents four critical prices: open, high, low, and close. The open price is where the stock started trading in the time frame, while the close price shows where it ended. The high and low prices mark the peak and lowest points reached within that period. For instance, if Reliance Industries shares open at ₹2,100 in the morning, rise to ₹2,150, drop to ₹2,090, and close at ₹2,130, the candlestick will reflect these levels. Understanding these prices tells you not just where the stock settled but how volatile it was during the session.
The body of the candlestick shows the difference between the open and close prices. If the close is higher, the body is often coloured green or white, signalling buying pressure. Conversely, a red or black body means sellers dominated, closing below the open. The thin lines above and below—the shadows or wicks—indicate the range of price fluctuations beyond the open and close. Longer shadows reveal significant swings during trading, suggesting indecision or a possible reversal ahead.
Candlestick charts present market sentiment visually, making it easier to gauge trader behaviour at a glance. When you see a tall green candlestick, it shows buyers were aggressive during that period. On the other hand, a series of red candles might signal weakness or a downtrend starting. This visual cue helps traders anticipate price movement rather than guessing randomly. For example, during a volatile session on the NSE, a hammer candlestick with a small body and a long lower shadow can imply that sellers tried hard but buyers pushed the price back, signalling potential support.
Compared to line charts, which merely connect closing prices, candlestick charts provide richer detail on intra-day swings. Unlike bar charts, candlesticks' clear body-colour coding helps beginners quickly spot market mood changes. While bar charts show the same data points, the visual impact is less intuitive. In fast-moving markets like India’s, candlestick charts allow traders to react faster and with more confidence.
Understanding the core components of candlestick charts empowers you to read market stories that raw numbers alone cannot tell.
This foundational knowledge is your key to interpreting patterns that signal opportunities or warning signs in stock trading. With continued practice, candlestick reading becomes second nature, guiding better trading decisions.
Recognising key candlestick patterns can give you a significant edge in understanding market movements. These patterns help reveal shifts in buyer and seller behaviour, signalling potential reversals or continuations in price. For beginners, focusing on well-established patterns is crucial before venturing into more complex analyses.
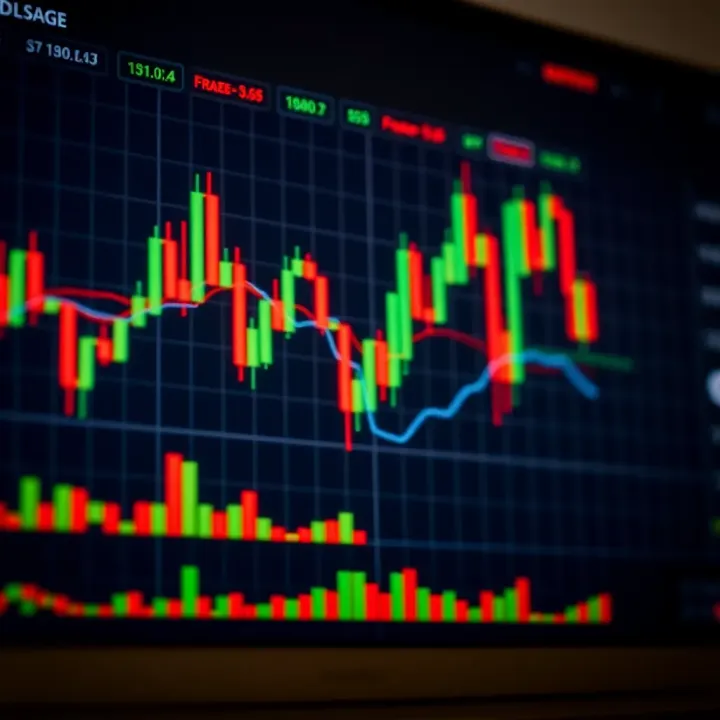
A Doji forms when a candlestick’s open and close prices are nearly the same, resulting in a very small body. This pattern suggests market indecision—buyers and sellers are roughly balanced. In practical terms, a Doji after a strong uptrend or downtrend hints at a possible reversal or pause in momentum. For instance, if Reliance Industries shows a Doji following several bullish candles, it may be a sign traders are reconsidering their positions.
Both look similar—they have small bodies and long lower shadows—but their meaning depends on where they appear. A Hammer appears after a downtrend and suggests that buyers are stepping in, possibly signalling a reversal upwards. Conversely, a Hanging Man occurs after an uptrend and warns of possible selling pressure ahead. For example, Tata Motors showing a Hammer in a downtrend could hint at a bounce-back, whereas seeing a Hanging Man atop a rally in Infosys might caution traders to tighten stop-loss levels.
This single-candle pattern displays a small body near the day's low and a long upper shadow. It typically forms after an uptrend and indicates that buyers pushed prices higher during the session but sellers regained control by closing prices near the open. This shift often points to a potential bearish reversal. For example, if Axis Bank’s daily chart shows a Shooting Star after a rally, it might be time to watch for weakening momentum or consider partial profit booking.
These patterns involve two candles where the second candle’s body completely engulfs the first. A Bullish Engulfing appears after a downtrend: a small bearish candle followed by a large bullish candle, signalling a possible upward move. A Bearish Engulfing happens after an uptrend and suggests a reversal downwards. Imagine HDFC Bank forming a Bullish Engulfing pattern—this could indicate buyers overpowering sellers and a trend change.
These are three-candle patterns marking strong reversal points. The Morning Star emerges at the end of a downtrend, starting with a bearish candle, followed by a small-bodied candle showing indecision, then a bullish candle confirming the reversal. The Evening Star is the opposite, signalling a reversal after an uptrend. Small traders watch these patterns closely as they often indicate clear entry or exit points.
The Harami comprises two candles where the second candle’s body is contained within the first candle’s body. A Bullish Harami appears in a downtrend and hints at a pause or reversal, while a Bearish Harami forms within an uptrend indicating weakening momentum. This pattern often calls for confirmation from subsequent price action or volume before taking position. For example, if Larsen & Toubro displays a Bullish Harami with rising volume, it could be a signal to watch for an upward move.
Key candlestick patterns alone don’t guarantee market direction but serve as valuable clues that, combined with other factors like volume and trend context, help you make better trading decisions.
Understanding these patterns lays the groundwork for practical and confident market analysis. Keep an eye on their formation alongside broader market trends and indicators for best results.
Candlestick patterns provide valuable hints about market direction, but using them effectively means combining them with other tools and managing risks wisely. Traders who simply rely on patterns may miss the bigger picture, leading to poor decisions. Practical tips help bridge theory and real trading scenarios, making your analysis more reliable and your trades safer.
Volume confirmation plays a key role in validating candlestick patterns. If a bullish engulfing pattern appears but volume is low, the signal may lack strength. Conversely, a spike in volume alongside the pattern suggests genuine market interest, increasing the chance of a strong move. For example, if shares of a Reliance Industries suddenly show a hammer candlestick after a downtrend with volume doubling average levels, it indicates buying interest, making it a more reliable reversal sign.
Moving averages smooth out price fluctuations, highlighting overall trends. Combining candlestick patterns with moving averages can improve timing. For instance, a bullish pattern forming above the 50-day moving average confirms the upward trend, offering better odds for a profitable trade. On the other hand, the same pattern below the moving average may signal a false move or weak momentum. This tactic works well on platforms like Zerodha Kite, which provide clear moving average overlays.
Stop-loss placement protects your capital when patterns fail. Placing a stop-loss just below the low of a bullish pattern safeguards against unexpected declines. For example, after spotting a morning star pattern on Infosys stock, setting a stop-loss a few points below the pattern’s lowest shadow limits losses if the reversal does not materialise.
Proper position sizing helps control overall portfolio risk. Rather than investing heavily based on a single pattern, adjust the trade size to your risk appetite and total capital. This way, even if the trade goes south, you avoid crippling losses. For instance, if you risk ₹10,000 per trade and a setup offers a ₹200 stop-loss, buying 50 shares keeps the risk within limits. This disciplined approach is key for beginners to trade confidently while protecting their funds.
Combining candlestick patterns with volume and moving averages, plus managing stop-losses and position sizes, turns basic pattern recognition into a practical, risk-aware trading strategy.
Following these tips allows you to apply candlestick patterns more effectively, balancing opportunity with caution in India's dynamic stock markets.
Understanding common errors helps beginners avoid costly pitfalls when trading with candlestick patterns. While these charts offer powerful insights, blindly trusting them without care can lead to wrong decisions and losses.
Many new traders fall into the trap of treating candlestick patterns as magic bullets. They spot a hammer or engulfing pattern and jump into a trade without considering other factors. This approach often backfires. For instance, a bullish engulfing pattern during a strong downtrend might not signal a genuine reversal but just a brief pause. Candlesticks work best when combined with volume, trend analysis, or moving averages. Relying solely on the shapes can mislead you, much like reading tea leaves without knowing the story behind the cup.
A candlestick pattern is just one piece of the puzzle. Beginners may miss how broader market conditions affect its reliability. For example, trading a shooting star pattern in a volatile, news-driven market like the post-Budget session can be tricky, since price swings may be exaggerated by external factors. Also, patterns that appear during sideways or range-bound markets might mean less than when they happen in clear trending markets. Paying attention to index movements like Sensex or Nifty, economic events, and sector performance adds crucial context before acting on patterns.
Correctly identifying patterns requires practice, but beginners often misinterpret them. For example, confusing a hanging man with a hammer can lead to opposite trades with different expectations. The shadows’ length, the candle’s position within a trend, and even the preceding candles’ behaviour matter a lot. A doji does not always mean indecision—it depends on where it forms during the trend. Misinterpreting these details turns potential advantages into costly errors. Studying charts regularly and using charting software with clear pattern recognition helps sharpen your skills.
Be cautious: Candlestick patterns are not foolproof signals but clues that need confirmation and context.
To sum up, avoid relying just on patterns, always consider what the wider market is doing, and carefully study the candles before trading. This approach helps beginners trade smarter and reduces avoidable mistakes.
Starting with the right tools and resources makes trading more approachable and less confusing. For beginners, having hands-on experience with reliable trading platforms and accessing quality educational materials can significantly improve understanding of candlestick patterns and overall market behaviour. This section highlights some popular platforms and reading materials tailored for Indian traders, helping build a strong foundation.
Zerodha Kite offers a clean, user-friendly charting interface widely used by Indian traders. Its candlestick charts come with a variety of technical indicators and drawing tools, letting you analyse price action effectively. Zerodha’s platform loads quickly even on moderate internet, which is great for users outside major metro areas. It also allows customisation of charts, so you can highlight specific patterns like bullish engulfing or doji clearly.
Upstox is another platform popular among beginners and seasoned traders alike. Its mobile app supports detailed candlestick charts with real-time data from NSE and BSE. What makes Upstox stand out is its integration with learning modules and market news directly within the app, helping traders stay updated while practising chart reading. The platform also offers competitive brokerage, making it appealing for those just testing waters with small investments.
Sharekhan combines comprehensive charting tools with expert market insights. Its software provides ready-made candlestick pattern alerts that beginners may find handy when scanning multiple stocks. Sharekhan’s educational webinars and customer support help new traders clarify doubts on pattern significance and usage. Though its interface may feel slightly complex initially, the resources it offers can deepen your technical analysis skills over time.
Books on technical analysis serve as a great starting point for traders wanting to understand the theory behind candlestick patterns. Classics like John J. Murphy’s Technical Analysis of the Financial Markets or Steve Nison’s Japanese Candlestick Charting Techniques explain both basic and advanced concepts with clear charts and examples. These books help build a strong conceptual framework, which is crucial before applying patterns practically on live charts.
Online courses focused on Indian markets offer practical learning customised to local trading behaviour and regulatory norms. Platforms such as the National Stock Exchange’s (NSE) certified courses or private initiatives like Elearn Markets offer sessions that cover candlestick patterns alongside government guidelines and tax implications. These courses often include interactive quizzes and hands-on exercises, helping you develop confidence without the guesswork.
Using well-chosen tools and reliable resources can help you avoid common pitfalls and trade with greater clarity. Starting small and learning consistently will pay off as you get more comfortable identifying and acting on candlestick signals.
📊 Learn to master candlestick patterns with practical tips & PDF guides! Perfect for traders of all levels aiming to improve their strategy and analysis.
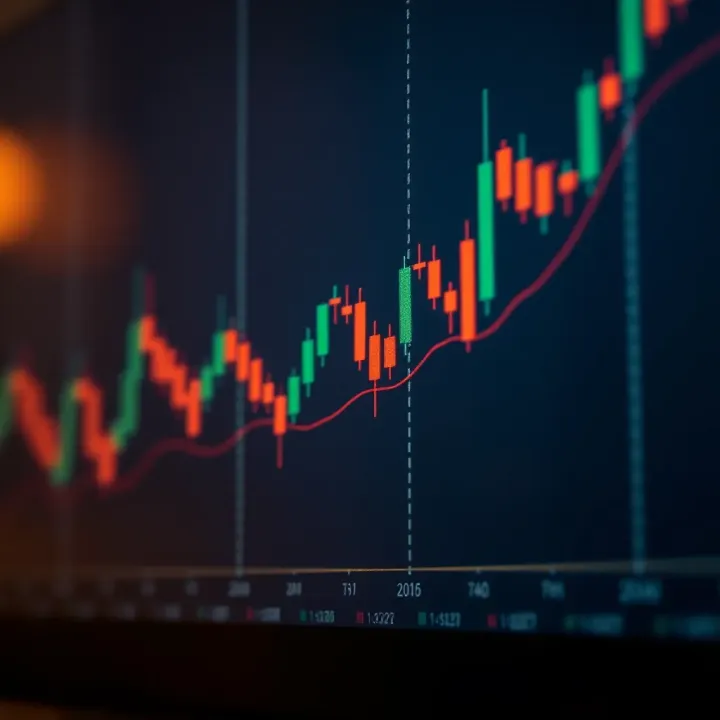
📈 Learn to read basic candlestick patterns to spot market trends and reversals confidently. Master these key tools for smarter trading decisions today!
📈 Master the top candlestick patterns for trading success! Learn their meanings, trader psychology, and practical tips plus handy PDFs for easy learning.
📈 Discover key candlestick patterns in trading! Learn to read single and multi-candle formations for smarter price move insights and better trade decisions.
Based on 15 reviews