

Understanding Multiple Candlestick Patterns in Trading
📊 Discover how multiple candlestick patterns work in trading, their meanings, and tips to use them effectively for better market decisions. 📈💡
Edited By
Charlotte Brooks
Bearish candlestick patterns help traders spot possible falls in asset prices, signalling a shift from a bullish to a bearish phase. These patterns form on price charts and give clues about market sentiment turning negative. Knowing how to read them enables traders to anticipate price drops and adjust their strategies accordingly.
Candlestick patterns consist of individual or grouped candlesticks that show price movements during a trading session. A bearish pattern typically indicates that sellers are gaining control, pushing prices lower. Recognising these patterns early can be crucial for traders aiming to protect profits or enter short positions.
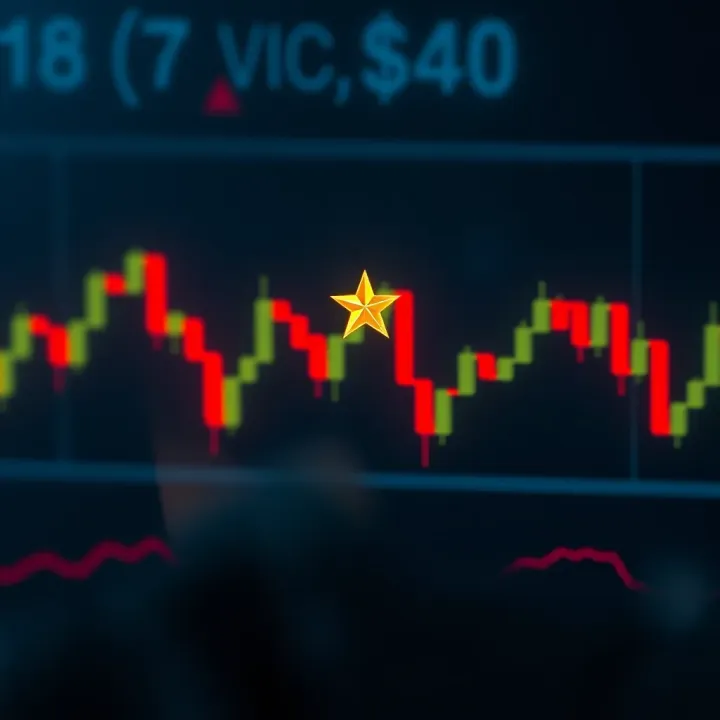
Here are some core aspects of bearish candlestick patterns:
Shape and Formation: Patterns usually comprise one or more candlesticks with particular arrangements, such as long upper shadows, small real bodies, or gaps down.
Context Matters: A bearish pattern appearing after a prolonged uptrend carries more weight than one in a sideways market.
Volume Confirmation: Adding volume analysis often strengthens the reliability of the pattern’s signal.
Bearish candlesticks form part of a wider toolkit that traders combine with support-resistance levels and technical indicators for better decision-making.
For example, the 'Evening Star' pattern involves three candles: a strong bullish candle, followed by a small-bodied candle (often a doji), and then a strong bearish candle closing well into the first candle’s real body. This pattern suggests a clear shift in momentum from buyers to sellers.
Similarly, the 'Shooting Star' single-candle pattern has a small real body near the low of the session with a long upper wick. It often signals a rejection of higher prices and potential trend reversal.
In practical terms, a trader spotting these signals might tighten stop-loss orders on long trades or start to consider short positions, while also watching other indicators such as the Relative Strength Index (RSI) or Moving Average Convergence Divergence (MACD) for confirmation.
Understanding these candlestick patterns provides a solid foundation for reading market sentiment and crafting responsive trading plans that manage risk and maximise opportunities.
Candlestick patterns are visual tools used in trading charts to show the price movement of an asset within a specific time frame. Each candlestick represents four key prices: the opening, closing, highest, and lowest during that period. The shape and colour of the candlestick help traders quickly grasp market sentiment. For example, a red (or black) candlestick generally shows a price drop, while a green (or white) one signals a rise. Understanding these patterns is essential because they reflect the psychology of market participants, helping traders anticipate subsequent price moves.
Bearish candlestick patterns specifically point to potential price drops or market reversals from an uptrend to a downtrend. These patterns often feature long upper shadows, small real bodies, or engulfing formations where selling pressure surpasses buying. For instance, the ‘Shooting Star’ shows buyers pushing prices up during the session but sellers regaining control by close, hinting at weakening momentum. Recognising such patterns allows traders to position themselves ahead of downturns, which is crucial in volatile markets like NSE or BSE where share prices can swing sharply.
Bearish patterns act like early warning signals for traders, highlighting moments when demand may falter and sellers could take over.
Bearish patterns alone don’t guarantee a fall; their reliability depends heavily on where they appear in the market cycle. A bearish pattern during a strong uptrend might only cause a minor pause rather than a full reversal. Conversely, the same pattern at the top of a rally could signal a significant decline. Therefore, combining candlestick analysis with broader market trends and other tools like volume or moving averages enhances decision-making. For example, spotting a bearish engulfing candle along with a drop in volume and a negative RSI divergence increases confidence that the price decline is genuine.
In short, mastering the basics of bearish candlestick patterns equips you to read price charts like a pro. That foundation lays the groundwork for identifying when to enter or exit trades, protecting your capital and maximising gains in the ever-changing markets.
Single-bar bearish candlestick patterns are among the simplest yet most effective tools for spotting potential price reversals. Their importance lies in signalling that selling pressure might be increasing, often marking the start of a downward trend. Traders benefit from these patterns because they are easy to identify on charts and provide timely signals to adjust positions or place stop losses.
Identification
The Shooting Star forms when a candle has a small real body near the lower end, a long upper shadow, and little to no lower shadow. This pattern usually appears after a price rise, showing that buyers pushed prices up during the session but sellers regained control before the close. For example, in a rising Sensex chart, spotting a shooting star often hints that bulls are losing steam.
Market Implications
This pattern warns traders that a price decline may follow, as it reflects bearish rejection of higher prices. In practical terms, it suggests the rally could be exhausted, prompting traders to consider short positions or tighten stop losses on long trades. However, using volume alongside the shooting star can confirm its strength — higher volume on the day it appears often signals stronger bearish conviction.

Formation Features
The Hanging Man looks much like the Shooting Star but appears after an uptrend. It has a small real body at the top of the trading range with a long lower shadow. This shows that during the day, sellers pushed prices down significantly, even though buyers managed to bring it back up partially.
Practical Use in Trading
Traders use the Hanging Man as a warning sign of a potential trend reversal. If it forms near resistance levels or after a sustained rise, it hints at growing selling pressure. However, confirmation is vital — a bearish candle following a Hanging Man or a drop in the next session should strengthen the sell signal. For instance, in Nifty trading, waiting for confirmation helps avoid false alarms.
Visual Characteristics
The Bearish Marubozu is a strong bearish candle with no shadows, meaning its open price is the high and the close is the low for the session. This shows that sellers controlled the price from start to finish without any pushback from buyers.
Signal Strength
This pattern is considered a very strong indicator of seller dominance and likely continuation of a downward move. Traders interpret a Bearish Marubozu as a clear sign to consider selling or exiting long positions, especially if it appears after a period of price stagnation or slight uptrend. For example, a Bearish Marubozu on a BSE stock chart with high trading volume often signals aggressive offloading by investors.
Single-bar bearish patterns work best when combined with other analysis tools like support/resistance levels, volume, and moving averages. They provide quick insights but should not be used in isolation.
Identifying and understanding these single-bar bearish candlestick patterns can improve your timing in the markets, helping you anticipate price drops and manage risk effectively.
Multi-bar bearish candlestick patterns give a more reliable signal compared to single-bar patterns because they reflect a shift in market sentiment over multiple trading sessions. These patterns help traders confirm if a downward move is gaining momentum. They are especially useful in volatile Indian markets where short-term price swings can be misleading. By observing patterns like Bearish Engulfing, Dark Cloud Cover, and Evening Star, you spot clearer signs of a possible price drop, allowing more confident trading decisions.
The Bearish Engulfing pattern develops over two candlesticks. The first candle is bullish, showing price rising during the session, while the second is a larger bearish candle that completely engulfs the body of the first. This shows sellers taking charge after buyers dominated, signalling a potential reversal. For example, in a stock like Tata Steel, this pattern often appears after a short rally, suggesting the bulls are tiring.
This pattern usually appears near resistance levels or after an uptrend, indicating a shift from buying pressure to selling. Traders consider it a strong reversal sign and might place sell orders or tighten stop-losses upon confirmation. However, checking volume is important; higher volume on the engulfing candle adds credibility. It's a practical tool when combined with indicators like RSI moving out of overbought territory.
Dark Cloud Cover forms over two sessions: the first is a strong bullish candle, and the second opens higher but closes below the mid-point of the first candle's body, casting a “dark cloud” over the previous optimism. In Indian markets, this might appear in stocks like Reliance Industries after a bullish run, showing hesitation among buyers.
This pattern signals weakening upward momentum and the chance of a reversal. Traders take this as a cue to reduce exposure or initiate short positions. The market often reacts with increased selling pressure soon after. It's wise to confirm with other tools, as sometimes the price might only pause before resuming the trend.
The Evening Star is a three-candle pattern: first a large bullish candle, followed by a small-bodied candle indicating indecision, and finally a strong bearish candle closing well into the body of the first candle. This sequence reflects a gradual shift from buyers to sellers over multiple sessions.
Evening Stars are considered more reliable than single or two-bar patterns because they show a real change in sentiment. Traders often wait for the third candle to confirm the reversal before acting. This pattern fits well in trading strategies dealing with swing highs in the market. For instance, it has been seen in NSE stocks like Infosys before notable corrections.
Recognising these multi-bar bearish candlestick patterns can improve timing for exit and entry points, essential for managing risks and maximising gains in trading portfolios.
Bearish candlestick patterns alone don’t guarantee market moves, but they serve as valuable early warnings for traders and investors to prepare for potential downward price action. Using these patterns within a broader trading strategy can improve decision-making by signalling when to reduce exposure or consider short positions.
Volume plays a key role in confirming bearish candlestick patterns. A sharp price drop with high trading volume often indicates strong selling pressure, making the bearish signal more reliable. For example, if a bearish engulfing pattern appears on the National Stock Exchange (NSE) stock of Reliance Industries accompanied by above-average volume, traders should take the signal seriously. On the other hand, low volume might suggest the pattern is weak or prone to reversal.
Technical indicators complement candlestick analysis. The Relative Strength Index (RSI) is a popular tool; a bearish pattern forming as RSI crosses below 50 or exits overbought territory adds weight to the forecast of declining prices. Similarly, moving averages, such as the 50-day or 200-day, can serve as dynamic resistance. If a bearish pattern forms near these moving averages, it may reinforce the likelihood of a price drop.
Relying on bearish patterns without risk controls can be costly. Traders should always set clear stop-loss levels above the pattern’s high or a recent resistance level to prevent large losses from false signals. For instance, after spotting a hanging man on Tata Motors’ chart, a stop loss placed slightly beyond the candle’s peak limits downside risk.
Position sizing is another key risk tool. When bearish signals appear, reducing the size of open long positions or cautiously increasing short exposure keeps risk in check. Hedging with options—like buying put options on a stock showing bearish signs—can offer protection during uncertain market phases.
Bearish candlestick patterns are not foolproof and sometimes deliver false alarms. A pattern might indicate a reversal, but the trend may continue due to broader market strength or fundamental factors.
Additionally, patterns often read better when combined with other analyses. For example, a dark cloud cover during a strong bull market might not lead to a significant fall. Seasonal and economic factors affecting Indian markets, such as budget announcements or global cues, can override candlestick signals.
Always view bearish candlestick patterns as part of a bigger picture, integrating volume, indicators, and macro events. This integrated approach helps avoid pitfalls and enhances trading outcomes.
Using bearish patterns effectively means blending them with confirmation tools, managing risk prudently, and understanding their limits to make informed trading choices in India’s dynamic markets.
Observing bearish candlestick patterns in the context of Indian markets brings clarity to how these signals behave with local dynamics like sector trends, economic announcements, and investor sentiment. Practical examples help traders and analysts grasp the nuances beyond textbook definitions, showing how patterns unfold in well-known stocks on major exchanges such as the National Stock Exchange (NSE) and Bombay Stock Exchange (BSE).
Take the case of Reliance Industries on the NSE around March 2023. After a strong upward rally, the stock formed a clear bearish engulfing pattern over two trading days. On the first day, the price closed near the high, indicating bullish strength. The next day saw a large bearish candle that completely engulfed the previous day's candle, signalling sellers gaining control. This was confirmed by increased volume, reflecting genuine selling interest. Reliance dropped about 3% in the subsequent week, validating the pattern's indication. Similar patterns were seen in ITC on the BSE during July 2023 when a dark cloud cover formation preceded a 4% correction over several sessions.
These case studies underline the importance of looking for volume confirmation and market context while using bearish candlestick patterns. Indian markets often respond sharply to global and domestic economic cues, so combining these patterns with macro factors improves prediction accuracy.
Bearish candlestick patterns help traders time their exit or short-selling strategies. For instance, spotting a shooting star at resistance in stocks like Tata Steel or Infosys may prompt traders to book profits or hedge their positions. However, acting on these signals without confirmation can lead to false alarms, especially in volatile markets like India.
Risk management becomes vital once a bearish pattern appears. Setting stop-loss orders just above recent highs can limit losses if the expected decline fails to materialise. Experienced traders also watch how these patterns align with overall market trends and sector performance.
Bearish candlestick patterns provide actionable cues, but in Indian markets where liquidity and sentiments vary widely, combining patterns with volume data and broader analysis safeguards against premature decisions.
To sum up, understanding specific examples from NSE and BSE stocks makes bearish candlestick patterns practical and relevant for Indian traders. Observing how these formations interact with local market rhythms helps in refining entry and exit tactics, ultimately improving trading outcomes.
📊 Discover how multiple candlestick patterns work in trading, their meanings, and tips to use them effectively for better market decisions. 📈💡

📈 Learn to read basic candlestick patterns to spot market trends and reversals confidently. Master these key tools for smarter trading decisions today!

📈 Learn to identify bullish candlestick patterns that hint at rising stock prices in Indian markets. Understand signals, confirmation, and trading tips for smarter investments.

📈 Master the top candlestick patterns for trading success! Learn their meanings, trader psychology, and practical tips plus handy PDFs for easy learning.
Based on 12 reviews