
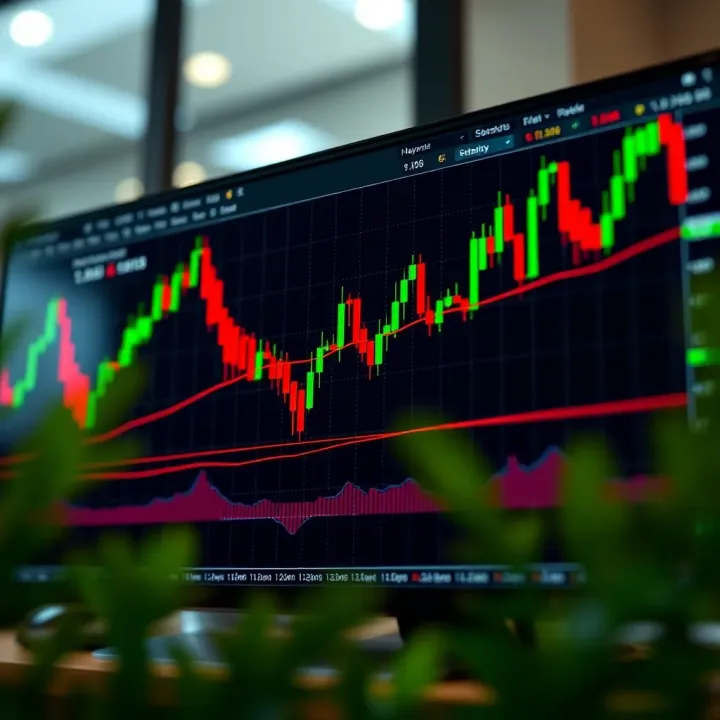
Mastering Multiple Candlestick Patterns in Trading
📊 Explore key multiple candlestick patterns in trading, their psychology, and how to interpret them for smarter decisions in India's stock markets!
Edited By
Liam Carter
Candlestick charts are a fundamental tool for traders analysing financial markets, especially in India’s dynamic stock exchanges like NSE and BSE. These charts provide a visual snapshot of price action within a specific time frame, using candlesticks that depict the opening, closing, high, and low prices. This clear illustration helps traders understand market sentiment quickly and make more informed decisions.
Each candlestick consists of a body and wicks (or shadows). The body shows the range between the opening and closing prices, while the wicks represent the day's highs and lows. A filled or coloured body usually indicates a price decline, and a hollow or lighter body shows a price rise, but this can be customised depending on the trading platform.

What makes candlestick charts particularly useful are the patterns they form over several sessions. These patterns signal potential market direction changes or continuations, essential for timing entry and exit points. For instance, a 'Bullish Engulfing' pattern shows that buyers have taken control, often followed by a price rally. Conversely, a 'Bearish Harami' signals potential reversal from a bullish trend to bearish.
Traders in India find these patterns especially handy due to the mixed nature of markets — influenced by domestic factors like RBI policy announcements and global events. Recognising patterns such as the 'Morning Star' or 'Evening Star' can alert investors to shifts before they become obvious on volume or moving averages.
Understanding these chart formations is not just about spotting patterns but also interpreting the psychology behind price movements — what buyers and sellers are signalling through their trades.
To navigate candlestick trading effectively:
Focus on patterns within the context of volume and overall market trend.
Combine candlestick signals with support and resistance levels.
Keep an eye on sector news and economic updates impacting market sentiment.
With consistent practice, you'll be able to spot these patterns on Indian stocks or other assets, improving your timing and confidence in market decisions. This article will walk you through the key candlestick patterns and practical tips relevant specifically to Indian markets.
Candlestick charts form the backbone of technical analysis and are vital for any trader or investor aiming to read price movement clearly. Unlike simple line charts that only show closing prices, candlestick charts provide detailed visuals of how price fluctuates within a given period. This depth helps identify market sentiment and potential turning points with greater accuracy.
Each candlestick represents a fixed trading interval, such as 1 day or 30 minutes. The opening price is where the first trade happened during that interval, while the closing price is the last price at which the asset traded before the interval ended. Knowing these two points reveals the general direction price moved within the period.
For example, if a stock opened at ₹500 and closed at ₹520 on a particular day, it indicates buyers pushed the price higher. Traders rely on this to gauge momentum; an upward close often signals bullishness for the session.
Wicks (also called shadows) are the thin lines extending above and below the candlestick body. They track the highest and lowest prices traded in that interval. These extremes can show market hesitation or rejection.
If a stock’s price spikes high but closes well below that peak, the upper wick will be long. This hints that sellers stepped in strongly at higher levels, potentially signalling resistance. Conversely, a long lower wick indicates buyers defended prices near the low, which may point to support zones.
The main body of the candlestick shows the range between open and close prices. Traditionally, a green or white body means the close was above the open, signalling buying pressure. A red or black body means the close was below the open, showing selling pressure.
Colours help traders quickly spot whether bulls or bears controlled the interval. For instance, a series of green candles often points to a positive trend, while consecutive red candles may confirm a downtrend.
Candlestick charts convey more than just price points. They illustrate the battle between buyers and sellers over time. The body size indicates how much prices changed between open and close, while the wicks reveal the extremes tested during trading. This combination helps traders understand volatility and market conviction.
In fast-moving Indian markets, such detail is useful for spotting entry or exit points, especially when prices react to news or economic data releases.
The shape and colour of candlesticks serve as straightforward signals of bullish or bearish conditions. A tall green candle with little wick hints robust buying interest, while a long red candle suggests strong selling.
Patterns made from multiple candles can enhance this message, but even a single candle provides clues. For example, a doji, where open and close are nearly the same, signals indecision, warning traders to watch for a reversal or continuation.
Understanding these basics helps traders make sharper decisions, interpret charts faster, and avoid misreading price swings in Indian markets. Candlestick charts are not just visual tools but a language reflecting market psychology in every tick.
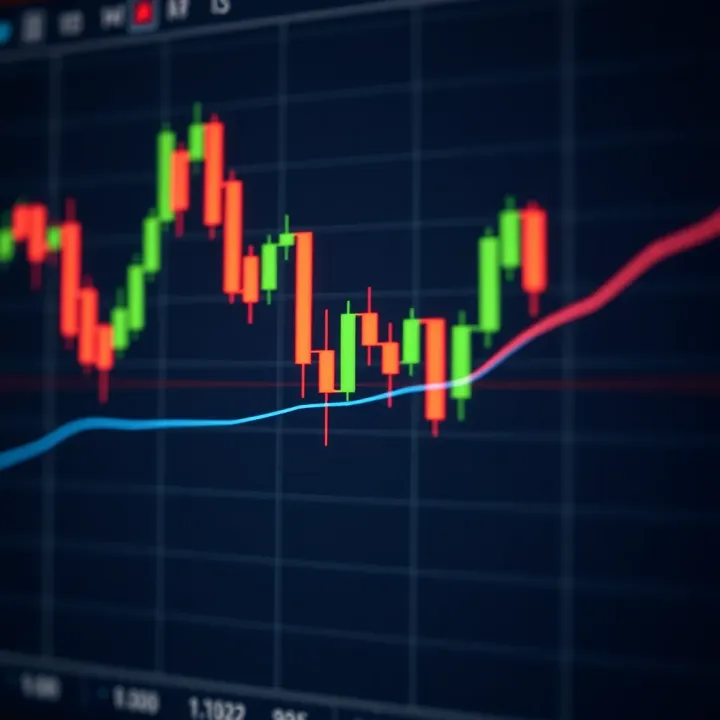
Single candlestick patterns offer quick signals about possible market directions, making them valuable for traders wanting to make timely decisions. These patterns provide insight by highlighting shifts in buying or selling pressure within a single trading session. Understanding them helps you spot moments when the market might pause, reverse, or continue its trend, which can be critical when timing entries or exits.
A Doji appears when the opening and closing prices of a trading session are nearly identical, forming a very small or non-existent body. Visually, it looks like a cross or plus sign, with wicks extending above and below. This pattern signals indecision, showing that neither buyers nor sellers took clear control during the session.
The Doji signals a potential pause or reversal in market momentum. For example, after a strong uptrend, a Doji suggests that buying interest may be fading and sellers might step in. However, it alone is not a definitive sign; traders often look for confirmation from following candlesticks or volume changes before acting.
Doji candles warn that the current trend's strength is tested but require confirmation to call a reversal reliably.
The Hammer candlestick has a small body near the upper end of its range and a long lower wick, usually at least twice the body length. This shape indicates that sellers pushed prices down during the session but buyers regained ground to close near the high. It often appears at the bottom of a downtrend, suggesting a possible bullish reversal.
The Hanging Man looks similar to the Hammer but occurs after an uptrend. It also has a small body near the top and a long lower wick. Its appearance hints that sellers tested the market strongly despite the overall uptrend, warning of a possible bearish reversal if confirmed by subsequent price action.
Both patterns highlight potential turning points. A Hammer at a downtrend's bottom can signal buyers returning and a price rise ahead, while a Hanging Man during an uptrend warns traders to be cautious about a pullback. Indian investors could use these signals to adjust stop-losses or take profits, especially during volatile sessions influenced by domestic triggers like RBI policy announcements.
Traders should always confirm these signs with other indicators or volume before making decisions, as false signals can appear without adequate confirmation.
Multiple candlestick patterns show how price movements evolve over two or more candles, revealing shifts in market sentiment. These patterns are particularly useful in spotting trend reversals or continuations. Unlike single candlesticks, they provide stronger confirmation for traders, helping to reduce false signals and improving trade timing.
Bullish Engulfing Explained
A bullish engulfing pattern forms when a small bearish (red) candle is followed by a large bullish (green) candle that completely 'engulfs' the previous candle's body. This suggests that buyers have gained control, overpowering sellers. For example, after a downtrend in a stock listed on the NSE, spotting a bullish engulfing pattern near a support level may signal a possible price reversal to the upside. Traders often take this as a cue to enter long positions or book profits on shorts.
Bearish Engulfing Description
Conversely, a bearish engulfing pattern appears when a small bullish candle is succeeded by a larger bearish candle that swallows it. This pattern indicates a shift from buying to selling pressure and often appears near resistance levels after an uptrend. For instance, a stock in the Nifty 50 showing this pattern near its recent peak could mean that bears are ready to push prices lower. Traders typically use this as a bearish reversal warning.
Trading Signals From Engulfing Patterns
Engulfing patterns are strong signals because they capture a clear battle between buyers and sellers over two periods. To improve reliability, it’s best to confirm these signals with volume spikes or support/resistance areas. High volume on the engulfing candle strengthens the possibility of a genuine trend change. In Indian markets, combining engulfing patterns with indicators like the 50-day moving average crossover often enhances decision-making.
Identifying a Morning Star
A morning star is a bullish reversal pattern consisting of three candles: a long bearish candle, a small-bodied candle (could be bullish or bearish) that gaps lower, followed by a long bullish candle closing near the midpoint or above the first candle’s body. This pattern suggests a slowdown in selling pressure and the start of buying interest. Traders spot morning stars after downtrends, especially near key support zones, as a sign to consider buying opportunities.
Recognising an Evening Star
The evening star is the opposite—a bearish reversal pattern often found near resistance after an uptrend. It includes a long bullish candle, a small-bodied candle that gaps higher, and a long bearish candle closing into the body of the first candle. This formation hints that buyers have lost momentum, and sellers might take over. Indian traders watch for evening stars to time exits or enter short trades.
Impact on Price Predictions
Morning and evening star patterns offer fairly reliable forecasts about upcoming price movement changes. When these patterns appear with confirming volume and are located at significant price levels, they can alert traders to a likely trend reversal. However, it’s wise to combine them with other technical tools like RSI or MACD for added confirmation. For example, a morning star aligned with an oversold RSI reading on a Sensex stock may hint at a sustained rise ahead.
Multiple candlestick patterns like engulfing and star formations serve as valuable guides for traders. They highlight changing forces between buyers and sellers, providing actionable signals that are clearer than isolated candlestick shapes alone.
Understanding these patterns can sharpen your entry and exit timing, making your trading in Indian markets more disciplined and less guesswork.
Relying solely on candlestick patterns can sometimes lead to false signals. That's why combining them with other technical tools is vital for better decision-making. By pairing candlestick formations with support and resistance levels, volume data, and moving averages, traders can confirm trends, reduce risks, and identify more accurate entry and exit points.
Support and resistance levels represent price points where buying or selling pressure tends to emerge. When a candlestick pattern forms near these levels, it often adds weight to the signal. For example, spotting a bullish engulfing pattern at a well-established support level suggests the price might reverse upwards from there. On the other hand, a bearish shooting star near resistance implies a possible decline.
Confirming signals with these price levels helps filter out weak patterns that appear in isolation. This practice increases confidence about whether a breakout or reversal is genuine.
Identifying clear entry and exit points becomes more precise when candlestick patterns line up with support or resistance. If a hammer forms at support, it could indicate a good buying opportunity with a tight stop loss just below that level. Conversely, a bearish engulfing near resistance might prompt a trader to book profits or short the asset. This approach optimises trade timing, reducing guesswork associated with market noise.
Volume plays a crucial role as confirmation. When a pattern like a morning star appears alongside increased trading volume, it signals strong participation from market players, making the move more trustworthy. Low volume on pattern formation often hints at weaker conviction, so cautious traders might wait for better confirmation.
Moving averages smooth out price fluctuations and highlight trend direction. Combining them with candlestick patterns can improve trend recognition. For instance, a bullish candlestick pattern crossing above the 50-day moving average may signal a shift towards an uptrend. Additionally, moving average crossovers, such as when the short-term 20-day crosses above the longer-term 50-day average, combined with bullish candlestick formations, reinforce buy signals.
By integrating candlestick signals with volume and moving averages, traders in Indian markets can avoid many false alarms common in volatile segments like midcaps and smallcaps. This balanced strategy results in more reliable trade setups, helping protect capital and enhance profits.
Successful trading often comes from confirming signals through multiple tools rather than relying on patterns alone. Combining candlestick charts with price levels, volume, and moving averages leads to well-rounded market analysis and smarter trades.
Understanding how to apply candlestick patterns effectively can enhance trading decisions, especially for Indian traders dealing with specific market conditions. The practical tips shared here focus on adapting candlestick chart analysis to India’s unique trading environment and avoiding common errors that can mislead even experienced market participants.
Indian stock markets often experience varying volatility levels due to domestic factors such as policy announcements, monsoon effects on agriculture sectors, and global market sentiments affecting export-heavy companies. Traders should be mindful that candlestick patterns may react differently during high volatility phases than in calmer periods. For example, a Hammer formation appearing during a volatile session might not reliably indicate a trend reversal if broader market swings overshadow this pattern.
Volatility can inflate wicks or shadows of candlesticks, which sometimes leads to false interpretations. It's wise to cross-check with volatility indicators like the Average True Range (ATR) or India VIX index before making decisions based solely on pattern shape or size.
The Indian markets have distinct trading sessions – pre-open, normal trading, and closing sessions – each with varying liquidity and volume. Candlestick patterns formed during the opening minutes often reflect immediate reactions to overnight global cues but might lack strength due to low volumes.
Patterns appearing towards the end of the trading day carry different implications as traders may close positions or square off intraday trades. Thus, a Bullish Engulfing pattern formed in the last 30 minutes of trading might need more confirmation from the next day's opening behaviour before acting on it. Timing your trades with session dynamics helps filter out misleading signals.
Relying on one candlestick pattern alone without context can be risky. For example, spotting a Doji might suggest indecision, but without considering recent market trends or volume data, this pattern remains incomplete.
A trader might jump into a trade on seeing a Hammer after a downtrend but miss that the volume is low or the broader market sentiment is negative, leading to losses. Combining multiple patterns over time or alongside other market information improves reliability.
Candlestick patterns serve best as tools signalling potential moves rather than guarantees. Ignoring additional indicators such as moving averages, Relative Strength Index (RSI), or volume trends weakens decision-making.
For instance, a Morning Star pattern signalling a bullish reversal becomes stronger if confirmed by rising volumes and a moving average crossover. Skipping such confirmation might cause one to enter prematurely.
Effective trading involves layering candlestick patterns with other market signals — this approach acts like a safety net against false positives.
In short, Indian traders benefit most from candlestick analysis that respects local market rhythms, accounts for volatility, and uses multiple tools to back up trades. Avoiding over-dependence on a single pattern and seeking confirming evidence boosts both confidence and success rates.
📊 Explore key multiple candlestick patterns in trading, their psychology, and how to interpret them for smarter decisions in India's stock markets!

📈 Explore the best candlestick patterns to read market mood and spot price moves. Learn single, double, and multiple setups to trade smarter and reduce errors.
📉 Understand key bearish candlestick patterns that predict price drops in trading. Learn formations, uses, and how to combine them with technical tools and risk strategies.

📈 Learn to read basic candlestick patterns to spot market trends and reversals confidently. Master these key tools for smarter trading decisions today!
Based on 5 reviews