

Understanding Numbers in Binary Code
Explore how numbers work in binary code 💻: basics, conversions, binary operations, and practical computer uses. Perfect guide for tech enthusiasts in India 🇮🇳.
Edited By
Sophia Clarke
The iron-carbon binary phase diagram is a cornerstone in understanding steels and cast irons, materials widely used across industries from automotive to construction. This chart maps how different phases form and coexist depending on temperature and carbon content, which typically ranges from 0% up to 6.67% in the iron-carbon system.
At its core, the diagram reveals key phases such as ferrite (almost pure iron, with very low carbon), austenite (a face-centred cubic phase stable at higher temperatures), and cementite (iron carbide, Fe3C). Each phase has distinct characteristics affecting strength, hardness, and ductility.
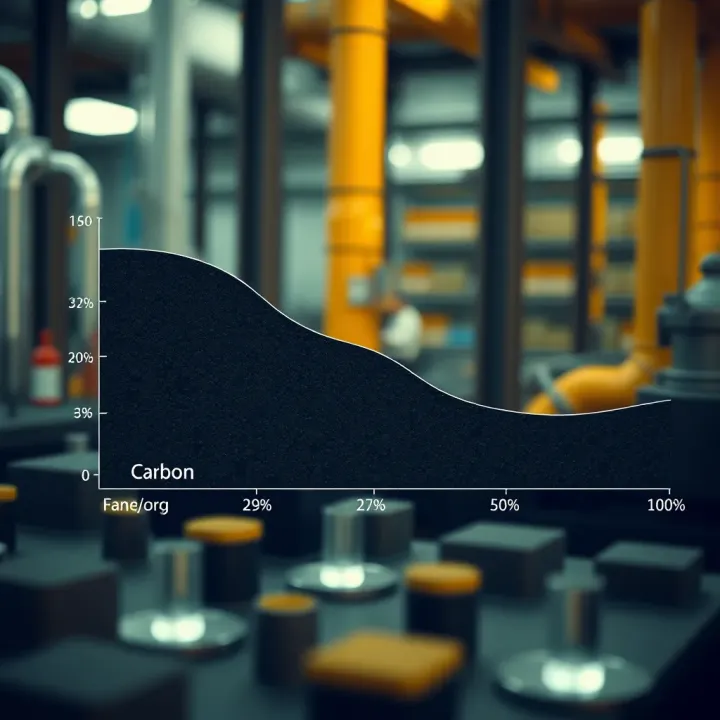
Understanding this diagram helps explain why carbon content drastically changes steel behaviour. For example, mild steel with 0.2% carbon behaves quite differently from cast iron containing over 2% carbon. The cooling path also plays a major role since slow cooling allows more equilibrium phases to form, while rapid cooling can trap metastable phases like martensite, crucial in heat treatment.
The iron-carbon diagram is not just theoretical — it guides real-world material choices and processing. Heat treatment processes such as annealing, normalising, and quenching rely heavily on this diagram to achieve desired mechanical properties.
Some notable features:
Eutectoid point at ~0.76% carbon and 727°C: Here austenite transforms into pearlite, a layered structure of ferrite and cementite.
Eutectic point at 4.3% carbon and 1147°C: Liquid transforms into a mixture of austenite and cementite, foundational for cast iron processing.
Critical temperatures (A1, A3, Acm): They mark phase boundaries vital for heat treatment planning.
Familiarity with these features aids traders and investors as well — understanding how steel quality varies with processing helps predict market demand for different grades, from construction steel to high-end automotive components.
In summary, the iron-carbon phase diagram provides a practical roadmap on how temperature and carbon shape steel properties. Knowing it helps professionals from students to brokers appreciate the science behind this ubiquitous material.
Carbon's role in iron alloys is more than just an additive; it fundamentally transforms iron’s properties. Even a small amount of carbon, like 0.02%, can harden iron and improve its strength. This is why steel, essentially iron mixed with up to 2.14% carbon, is so much tougher than pure iron. Carbon atoms fit into the iron crystal lattices, changing how the atoms slide over each other and thus influencing hardness and ductility. For example, when carbon content rises, steel becomes harder but less flexible — something manufacturers balance depending on the use, whether it’s for making razor-sharp knives or sturdy construction beams.
Industrially, iron-carbon alloys are the backbone of modern infrastructure and manufacturing in India and worldwide. From railways rolling stock to automobile chassis and kitchen utensils, these alloys support a range of applications. The iron-carbon system explains why certain steels behave differently during forging, welding, or heat treatment. This system’s practical importance lies in guiding engineers and metallurgists to design alloys with the right mix of strength, toughness, and wear-resistance, avoiding guesswork and costly trial-and-error.
The iron-carbon phase diagram focuses mainly on carbon content from 0% up to around 6.7%. This might look narrow but covers all major steel and cast iron grades. Steels usually contain less than 2.14% carbon, while cast irons go beyond that up to roughly 4.3%. By understanding this range, industries can select the exact composition that meets specific strength, wear, or machinability requirements. For example, grey cast iron, popular in engine blocks, sits in higher carbon regions, offering good vibration damping but less strength.
Temperature range plays a key role too. The diagram tracks phase changes roughly between room temperature and 1600°C, covering melting and solid-state transformations. This is crucial for heat treatments like annealing or quenching that happen at precise temperatures to alter microstructures. A builder wanting tougher steel for a crane would refer to how phases change at heating points near 727°C, the eutectoid temperature, to plan heat treatment. So, the diagram isn’t just theoretical; it provides a temperature map that directly affects industrial processes.
Knowing the iron-carbon system helps you predict how an alloy behaves when heated or cooled, making it invaluable for steel design, casting, and heat treatment decisions.
Carbon range: 0 to 6.7% covers practical steel and cast iron varieties
Temperature range: room temp to melting (~1600°C) guides processing
Practical for choosing alloy compositions and heat treatment plans
Understanding these aspects lays the groundwork to grasp the phases and transformations we’ll explore in the following sections.
The iron-carbon phase diagram depicts several critical phases that determine the properties of steel and cast iron. Understanding these phases—ferrite, austenite, cementite, pearlite, and others—*helps in predicting material behaviour during heating and cooling. This knowledge is vital for engineers, metallurgists, and investors dealing with steel production or trading, as phases influence strength, hardness, and ductility.
Crystal structures and properties: Ferrite, also called alpha (α) iron, has a body-centred cubic (BCC) crystal structure. It is relatively soft, ductile, and magnetic at room temperature, making it a key component of mild steel. Austenite, or gamma (γ) iron, features a face-centred cubic (FCC) structure, which allows it to dissolve a higher amount of carbon. It appears only above 727°C and is non-magnetic. Its unique structure helps in improving toughness and strength when transformed.
Carbon solubility limits: Ferrite holds very little carbon—up to 0.02% at 727°C—so excess carbon tends to form other phases. Austenite, however, can dissolve carbon up to 2.1% at 1,140°C; this broad solubility enables formation of stronger alloys with varied microstructures on cooling. Controlling carbon solubility is crucial during heat treatment to tailor steel’s final properties, like hardness and corrosion resistance.
Composition and role in microstructure: Cementite (Fe3C) is an iron carbide compound rich in carbon (6.67%). Though hard and brittle, it contributes to steel’s overall strength. Cementite typically appears as thin plates or grains embedded in a softer matrix, influencing wear resistance.
Pearlite is a layered microstructure composed of alternating lamellae of ferrite and cementite. It forms when austenite cools slowly below the eutectoid temperature. Pearlite balances hardness and ductility, commonly seen in construction steel where toughness matters.
Formation and characteristics: Pearlite forms by diffusion-controlled transformation, where carbon moves from austenite into ferrite and cementite layers. The thickness of the lamellae varies with cooling rate—slower cooling yields coarse pearlite, which is softer; faster cooling produces fine pearlite with higher strength. This relationship guides industrial processes like annealing and normalising to meet specific performance needs.
Ledeburite structure: Found only in cast irons, ledeburite is a eutectic mixture of austenite and cementite, solidifying at about 1147°C with 4.3% carbon. It forms a network-like structure that imparts high hardness but low ductility. This phase explains the brittleness of white cast iron and helps in selecting suitable grades for wear-resistant applications.
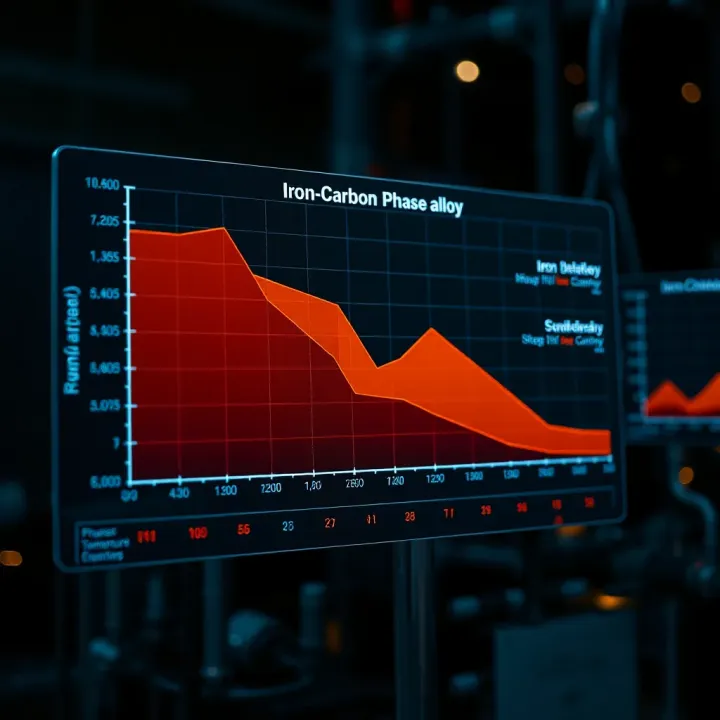
Graphite formation in cast irons: In grey cast irons, carbon precipitates as graphite instead of cementite, giving the metal excellent machinability and vibration damping. Graphite flakes disrupt the matrix, reducing strength but improving thermal conductivity. This phase is central to choosing cast irons for engine blocks or pipes, where casting properties and thermal behaviour matter.
These key phases collectively shape the behaviour of iron-carbon alloys, and understanding them helps in predicting performance under various service conditions.
By recognising how these phases form and transform, professionals can better control manufacturing and quality, making the iron-carbon diagram an indispensable tool for the steel and cast iron industry.
Critical temperatures mark important points on the iron-carbon phase diagram where distinct phases form or transform. Understanding these allows manufacturers and engineers to control the microstructure and properties of steels and cast irons through heat treatment. Key temperatures include eutectoid and eutectic points, which define the compositions and conditions for phase changes.
The eutectoid point occurs at approximately 0.8% carbon and 727°C. Here, a single phase, austenite, transforms into two different solid phases simultaneously — ferrite and cementite — forming pearlite. This transformation is crucial because it defines the boundary between low and high carbon steels. On the other hand, the eutectic point lies at 4.3% carbon and about 1147°C, where liquid iron-carbon mix solidifies directly into a mixture of austenite and cementite. This point is especially relevant to cast irons with high carbon content.
Knowing these temperatures helps in setting furnace conditions during steelmaking and casting. For example, if the aim is to produce pearlitic steel, slow cooling from just above 727°C helps form this microstructure. Conversely, to avoid brittle phases, one might control cooling rates near the eutectic composition.
Phase changes at these critical points affect mechanical properties directly. The eutectoid transformation controls the balance between hardness and ductility in steels. Fine pearlite formed near the eutectoid composition is harder and stronger but less ductile than ferrite-rich microstructures. For cast irons, solidification at the eutectic point determines the amount and distribution of cementite, influencing brittleness.
Understanding these phase changes also aids failure analysis. For instance, if crack initiation occurs near the eutectoid temperature due to improper heat treatment, adjusting cooling schedules becomes necessary. Thus, critical temperatures serve as practical guides in processing and quality assurance.
When austenite cools down below the eutectoid temperature, it transforms into pearlite, a layered structure of ferrite and cementite. The kinetics depend on cooling rate; slower cooling yields coarse pearlite, while moderate rates can produce fine pearlite. This transition governs the hardness and strength of medium to high carbon steels.
For example, railway tracks use pearlitic steels for balancing wear resistance and toughness. Precise control of this transformation during heat treatment ensures the final product performs reliably under heavy loads. Knowing how austenite decomposes into pearlite is vital when designing heat treatment processes for structural applications.
Martensitic transformation is a diffusionless change where austenite rapidly cools (quenches) below a certain temperature, usually around 200°C, to form a hard, brittle phase called martensite. This phase has a distorted body-centred tetragonal crystal structure, trapping carbon atoms in solution.
This transformation is central to hardening steels. Quenching produces high hardness but low toughness, so subsequent tempering is needed to improve ductility. For cutting tools and wear-resistant parts, martensitic steels offer superior performance. Understanding this transformation helps balance hardness and brittleness through controlled heat treatment, ensuring steels meet specific mechanical demands.
Critical temperatures and transformations are the backbone of steel processing, directly influencing the strength, hardness, and durability of iron-carbon alloys used in everyday applications.
Understanding these fundamentals helps traders, investors, and analysts grasp why certain steel grades command premiums or face challenges based on their production complexities and properties.
The iron-carbon binary phase diagram plays a key role in understanding the properties and applications of steel and cast iron. It helps classify steel grades and cast iron types based on their carbon content and microstructure, directly influencing their mechanical behaviour in real-world applications. For traders and investors dealing in steel commodities, recognising these differences can guide smarter decisions aligned with market demands and manufacturing trends.
Steel is broadly classified by carbon content into low-carbon, medium-carbon, and high-carbon types. Low-carbon steels, containing up to about 0.25% carbon, are widely used in construction and automotive parts due to their good ductility and weldability. Medium-carbon steels, with 0.25–0.6% carbon, offer a balance of strength and toughness, making them suitable for gears, shafts, and railway tracks. High-carbon steels, exceeding 0.6% carbon, are much harder and used where wear resistance matters, such as cutting tools and springs.
Cast irons differ significantly from steels, mainly because they contain 2–4% carbon and other elements like silicon. They are classified by graphite shape and matrix structure into grey, white, ductile, and malleable cast irons. Grey cast iron has flake graphite, giving it excellent vibration damping and machinability used in engine blocks and pipes. White cast iron, with carbon in cementite form, is very hard but brittle, so it suits wear-resistant surfaces. Ductile cast iron, with spherical graphite, provides good strength and toughness ideal for automotive and heavy machinery.
Carbon content dramatically affects hardness, toughness, and ductility in steels and cast irons. Increasing carbon typically raises hardness and strength but lowers ductility, making the material more brittle. For example, low-carbon steels are softer and easier to shape, but high-carbon steels can withstand heavy loads without deforming easily. This trade-off must be balanced depending on the application.
Strength in iron-carbon alloys rises with carbon content because carbon atoms restrict dislocation movement in the iron lattice. However, excessive carbon leads to carbide formation like cementite, reducing toughness. In cast irons, high carbon and complex microstructures result in high compressive strength but poor tensile strength compared to steels. Thus, understanding the phase diagram allows controlling carbon content to meet specific mechanical needs without compromising safety or performance.
Being aware of these classifications and their mechanical impacts helps investors and engineers predict material behaviour, optimise usage, and adapt to market requirements efficiently.
Heat treatment processes such as annealing, normalising, quenching, and tempering rely heavily on the iron-carbon binary phase diagram to control the microstructure and properties of steel and cast iron. The diagram maps temperature and carbon content to specific phases, helping metallurgists decide precise heating and cooling paths to achieve desired hardness, ductility, or toughness.
Annealing softens steel by heating it above the austenitising temperature and then cooling it slowly, usually inside a furnace. The main goal is to relieve internal stresses, refine the grain structure, and improve machinability. For example, low-carbon steels can be annealed to make them easier to shape without cracking.
Normalising heats steel to a similar temperature as annealing but cools it in still air, leading to a finer grain size than annealing. This process balances strength and toughness, making it widely used for medium-carbon steels like those in automotive components.
Quenching involves rapid cooling, typically in water or oil, to lock in a hard, brittle phase called martensite. This sudden temperature drop doesn’t allow carbon atoms enough time to diffuse out, leading to a supersaturated structure. Quenched steels find their use in cutting tools and wear-resistant applications.
The iron-carbon diagram guides these processes by showing critical points like the A1 (eutectoid) temperature. For instance, to anneal a 0.8% carbon steel, it must exceed the A1 temperature (~727ºC) to form austenite before slow cooling. If not heated sufficiently, desired phase changes won’t happen.
Similarly, the diagram helps identify the right austenitising temperature for normalising and quenching, ensuring steel enters the single-phase austenite region. Knowing the carbon content directs how long to hold at temperature and the cooling speed required to reach target phases without forming unwanted compounds like cementite.
Tempering follows quenching to reduce brittleness and improve toughness by reheating quenched steel below the A1 temperature, usually between 150ºC and 650ºC. It adjusts hardness by allowing some martensite to transform into more stable phases.
This process is relevant practically because it tailors microstructure for applications needing both strength and ductility. For example, tempered high-carbon steel can make durable, less brittle knives.
Microstructurally, tempering relaxes stresses trapped during quenching and produces fine carbides from excess carbon. These changes decrease hardness mildly but enhance toughness. The iron-carbon diagram indicates the safe temperature range for tempering without reversing desired phase transformations.
Accurate control of heat treatment timing and temperatures, guided by the iron-carbon phase diagram, directly shapes steel's mechanical properties, making it indispensable for foundries and manufacturing industries.
Understanding these processes through the diagram equips engineers and traders with insights to evaluate metals’ quality and suitability based on treatment history and intended use.
In industrial settings, cooling rates rarely match those assumed in equilibrium diagrams. Rapid cooling, like in quenching, can lead to phases that do not appear on the diagram, such as martensite. For example, when steel cools quickly from the austenite phase, it transforms into martensite rather than pearlite due to suppressed diffusion. This drastically changes mechanical properties, especially hardness and brittleness.
Slower cooling tends to follow the phase boundaries more closely, allowing carbon atoms to diffuse and form equilibrium phases like pearlite or cementite. Industries need to control cooling rates carefully based on the desired microstructure. This highlights the necessity of pairing the iron-carbon diagram with practical heat treatment knowledge rather than relying on it alone.
The phase diagram represents ideal conditions achieved through equilibrium processes, which are seldom met in production. Real steels often show phase boundaries shifted by impurities, stress, or deviations from perfect composition. For instance, the eutectoid temperature can vary slightly depending on processing history and alloying additions.
This deviation means engineers must account for real-world factors beyond the simple two-component system. Techniques such as dilatometry or in-situ microscopy help monitor phase transformations during cooling, offering a more precise understanding beyond the theoretical boundaries.
Elements like manganese (Mn), silicon (Si), chromium (Cr), and nickel (Ni) are common in steel and influence phase stability. Manganese, for instance, expands the austenite region, allowing higher carbon solubility at elevated temperatures. This is useful in producing steels with improved toughness and wear resistance without compromising hardness.
Silicon generally strengthens ferrite and suppresses the formation of cementite, affecting hardness and ductility. These alloying additions impact not only mechanical behaviour but also corrosion resistance and weldability, which the simple iron-carbon diagram does not capture.
Because real steels contain multiple elements, the binary iron-carbon diagram needs adjustment to reflect these complexities. Engineers use modified phase diagrams or ternary/quaternary phase diagrams including alloying elements to predict behaviour more accurately.
For example, adding chromium requires consulting the iron-chromium-carbon ternary diagram to understand carbide formation and phase stability. In practice, software tools and CALPHAD (Calculation of Phase Diagrams) methods provide updated diagrams tailored for specific alloy compositions—helping industries design steels with targeted properties.
While the iron-carbon diagram provides a solid foundation, practical steel design demands attention to cooling conditions and additional elements to control material performance effectively.
Explore how numbers work in binary code 💻: basics, conversions, binary operations, and practical computer uses. Perfect guide for tech enthusiasts in India 🇮🇳.

Learn how binary digits 0 and 1 power computing systems 🔢. Understand conversions, logic behind binaries, and their role in everyday technology 📱💻.

Explore how binary traders in India operate, understand legal issues, risks, and top platforms 📊. Get practical tips for safe trading in the Indian market 🇮🇳.

🔍 Understand the recursive binary search algorithm for quick target search in sorted arrays. Learn stepwise implementation, benefits over iteration, and real use cases.
Based on 7 reviews